FC 2009 Point Cloud
3D Point Cloud of 512 Fursuits
2009
Assuming you were at Further Confusion 2009 and around during the fursuit parade, you may've seen a beat up truck with some spinny things on it. Or, you may've been in a fursuit and told to get in a line around the median and then a guy with a bullhorn walked around and yelled "HOLD YOUR POSE" constantly without really explaining what was going on. Or, maybe you weren't even there.
You should've been. It was fun.
Either way, this page should answer any questions you have about the above paragraph.
The follow story took place at Further Confusion 2009, a yearly furry fandom convention held in San Jose, CA. Specifically, this happened during the fursuit parade (for those not familiar with fursuit parades, there's a description here. Ignore the footnote. I totally count.). To say the experience is surreal is an understatement.

At the 2009 con, there were 530 suits in the parade, and over 2500 attendees overall.
I've been going to Further Confusion for the past 3 years (for the record, I'm a cube), and it always ends up being an interesting time. While I was working at Linden Lab, I ran the Second Life panel, which was one of the few times I was subjected to real life, phsyical griefing attacks. In 2006, I managed to video a line dance, get sued for doing so and then thanks to the EFF, win the case and open source the dance under the Creative Commons License. I even have a cubesuit that I wear in the fursuit parade, which, in 3 years of use (sadly, as of 2009, the cubesuit is dead. Long live cubesuit v2, to be seen at FC2010) has somehow has not gotten me beaten senseless by everyone else in the parade. Yet.
Like I said. Interesting time. I just couldn't let this year go by being any less interesting.
The scanning system was created by 510 Systems, a navigation, robotics, and controls research lab located in Berkeley, CA, who I was working for at the time. They research and create solutions related to problems in high accuracy navigation, surveying, and geographic data analysis.
Or, more to the point, there's some robotic bulldozers and cars that drive themselves and lasers. Lots of lasers.
To give you an idea of some of the things this company has done:
They also have vehicle mounted systems that can create a 3D "point cloud" of the area surrounding the vehicle, through a combination of specialized hardware, sensors, and processing software. It looks something like this.
The week before FC2009, I was telling some of my con stories to a couple of coworkers over lunch. After explaining the fursuit parade, I joked that we should take one of our scanning vehicles and create a 3d scan of the fursuit parade. To my surprise, this got a positive reaction, plans were made, and come Saturday, the truck showed up.
Holy crap, we were actually gonna do this thing.
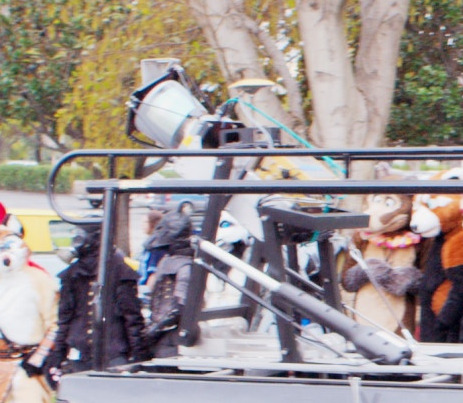
This is the truck, and more importantly, this is our system that is attached to the truck.
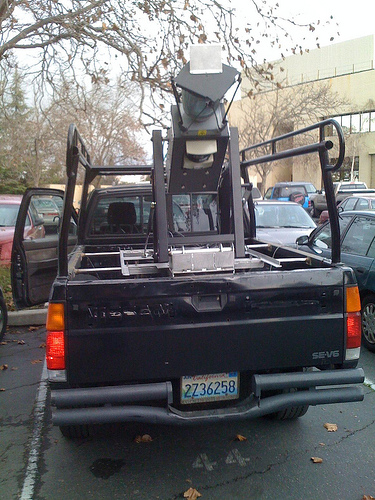
And from the side:
The rig in those pictures consists of (to get an idea of placement, go to the flickr picture in the first link):
This isn't all the sensors the IP-S2 can handle, but reflects the set we had on the truck that day. As the truck is driven around, all of the sensors listed above feed data into the IP-S2, which then feeds it into another computer. All of this data is very, very accurately timestamped.
What does this get us?
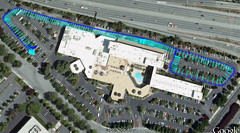
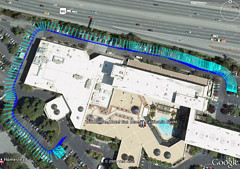
To give you an idea of uses for this system… Say you're a department of transportation, and you want to know where your streets are painted, with what, and if they need to be repainted. Now, you could send drivers out to eyeball this. But, with the system above, when all of the data comes back together, you can see things like this:
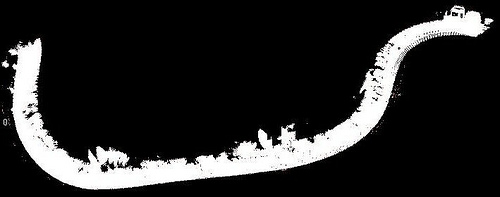
The scan above is from the Doubletree Hotel parking lot, taken during the parade. Each one of those points that make up the image scan is georeferenced, and you can see both the old arrow and the newly repainted ones. With some processing, you can even have software pick out features these features, and possibly have it give back a rating of the quality, so that if something needs to be repainted, the software can add that to a schedule automatically.

Or you can take scans of people in fursuits. Isn't living in the future fun?
Ok, down to business. Here's the information on the scans we took at FC.

Before we can go into what can be done with the data, we need to discuss what data is available. The data is presented on a per-point basis, but the main question, what data can be used where? Well, let's take a look at a couple of pictures.
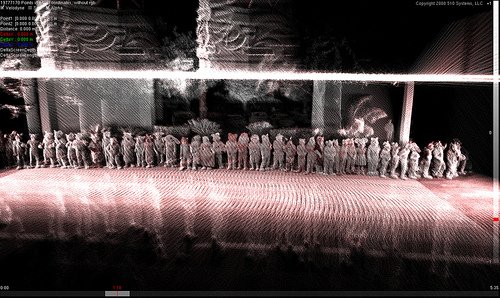
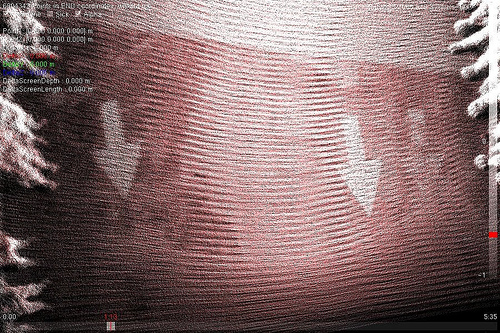
This cloud is made up of 5 million points, about the maximum the House of Cards Renderer (see the Available Software Section) can handle before choking. We call this number our point budget. Now, you're probably saying /"BUT I CAN RUN THE CRYSIS ENGINE AT MAXIMUM WHY CAN'T I RENDER MANY POINTS WAAAAAAAAAAAAAAH."/. Well, get ahold of yourself. When rendering point clouds, it's a completely different ballgame. Since the points are disconnected, you can't use point indexing. Since there's no polygons, there's none of the pipeline optimizations inherent in using triangles. Of course, there's solutions for these problems, mainly having to do with spacial data structures and compression that can easily deal with hundreds of millions of points, but since the easiest way for everyone on every platform to view the clouds was using the prewritten, Processing (and therefore java) based House of Cards viewer… Well, there you go.
So, yeah, 5000000 points up there. If you look at the larger version of it (available on flickr), you'll notice that we're blowing a TON of our point budget on the large, flat surfaces in the surrounding world. The road, the hotel, things like that. Now, a point reduced version.
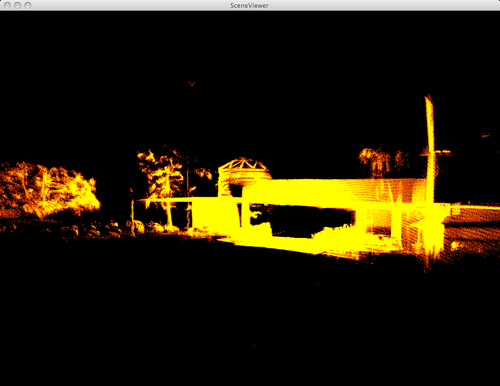
This is a zoomed out version of the full first pass of the fursuit parade. This whole view is only 3,405,808 points. This was created by isolating the usable scan angles to a 30 degree arc, and limiting the maximum acceptable scan distance to around 5m from the sensor position at the time of laser firing. This still gets all of the suit data into the cloud, while eliminating the road, the hotel detail, other people, etc…
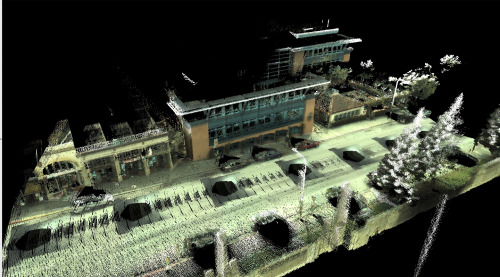
Now, this data can sometimes be interesting. For instance, this shot taken during the second run:
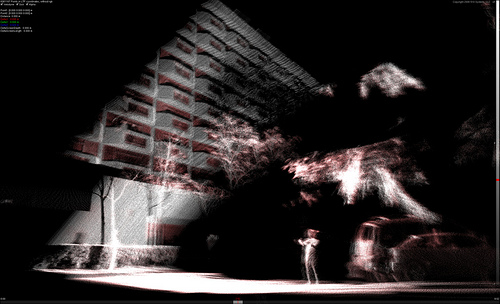
This shot got the whole back of the hotel, which, while filling up the point budget quick, looks really cool.
